
Caitlin Carpenter
Data Analyst
Tableau | Excel | SQL
About Me
Welcome to my portfolio!I'm a high school agricultural construction teacher, with a passion for learning new skills.
I believe in arming yourself with the right tools to do the job -
both in the classroom and the boardroom.Here you will find the projects that have helped me sharpen those skills to build a career that I am passionate about. While these projects showcase where I am at now, I believe in the power of continuous learning.In July 2022, I started taking courses through Break Into Tech and Pluralsight to hone in on the skills necessary for data analysts. I learned technology develops at a rapid pace, so I am continuing to develop my technology skills as well.Please take your time, explore and hopefully learn something new! As a teacher, I am always here to help other build their skillsets along the way!Join me over on LinkedIn to see more about my projects and journey, and
join in on the conversation.
Tableau
S&P 500 Stock Prices
Analysis of historical stock market data for current S&P 500 companies from 2014-2017.
Electronic Store Sales
Analysis of sales from February 2019 from a fictional Electronics store.
Excel
#66DaysofData
Analysis of my personal LinkedIn data from the first 43 days of the #66DaysOfData challenge.
SQL
Media Store Analysis
Analysis of sales from a fictional Media store.

Business Questions
A variety of business questions answered for practice.
Courses Taken

Description: Introductory course to data analytics that teaches the basic technical skills and how to create a beginner portfolio.
Skills Learned:
SQL: SQLite, PostgreSQL, JOINs, CASE, Aggregate functions, Subqueries, CTEs, Window Functions
Tableau: Connecting to data, Creating charts, Calculated Fields

Description: A variety of courses on Pluralsight from the pathway about different SQL topics, RDBMS and syntaxes. Total of 8 classes for a total of 13.5 hours of content.
Skills Learned:
MySQL, T-SQL syntax, JOINs, CTEs, Subqueries, Unions, Window Functions, Aliases, Updating or Changing Tables, Creating Tables, Table Constraints and More.

Description: Pathway of 8 courses on Pluralsight for a total of 16 hours and minutes of content.
Skills Learned:
Connecting to Data, Manipulating Data, Creating Charts Best Practices, Mapping Spatial Data, Building Effective Dashboards, Calculated Fields, KPI Bands, Annotations, LOD expressions, Parameters, Top N filters and more.

Microsoft Excel Data Manipulation, Presentation, and Analysis
Description: Pathway of 11 courses on Pluralsight for a total of 15 hours of content.
Skills Learned:
Connecting to External Sources, Tables, Charts, Pivot Tables, Pivot Charts, Formatting Objects, Formulas (VLOOKUP, XLOOKUP, INDEX, MATCH, Etc.), Distributing Excel Workbooks.

Description: Pathway of 21 courses on Pluralsight for a total of 44.5 hours of content.
Topics Learned:
Understanding Your Audience, Listening Skills, Effective Written Communication, Running Meetings, Presentation Design, Presentation Skills, Objectivity in Data Visualization, Communicating Data and Analysis Results
Description: Pathway of 6 courses on Pluralsight for a total of 4 hours of content.
Topics Learned:
What is Scrum, Scrum Roles, Scrum Events, Scrum Artifacts, Product Backlog, and Implementing Scrum.
Contact Me
Tableau | S&P 500 Stock Prices

THE DATA:
I analyzed historical stock market data for current S&P 500 companies, from 2014-2017. Each record represents a single day of trading, and includes the ticker name, volume, high, low, open and close prices. The data set was the Maven Analytics Data Playground.QUESTIONS:
1. Which date in the sample saw the largest overall trading volume?
2. On that date, which two stocks were traded most?
3. On which day of the week does volume tend to be highest? Lowest?
4. On which date did Amazon (AMZN) see the most volatility?
5. If you could go back in time and invest in one stock from 1/2/2014 – 12/29/2017, which would you choose? What % gain would you realize?INSIGHTS:
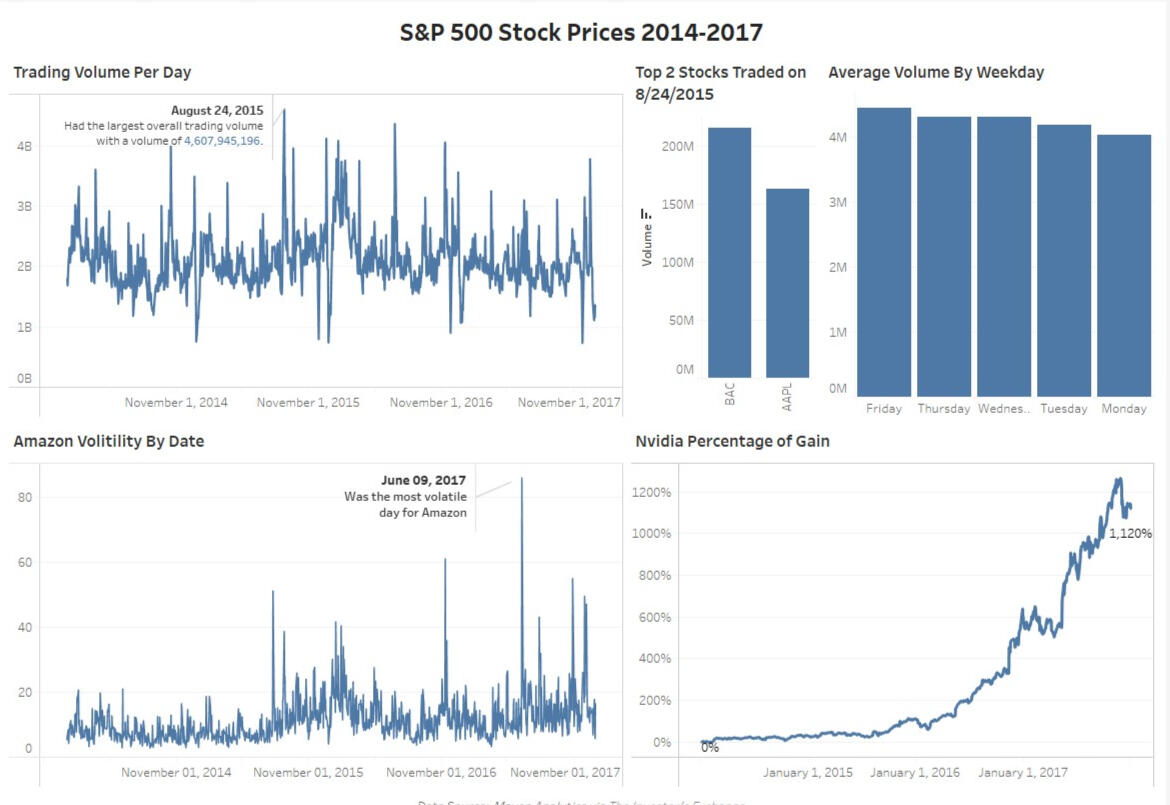
1. August 24, 2015 had the largest overall trading volume.
2. The two stocks traded the most on August 24, 2015 were BAC and AAPL.
3. Fridays had the largest trading volume while Mondays had the lowest.
4. Amazon (AMZN) saw the most volatility on June 9, 2017.
5. I would choose Nvidia (NVDA) with a percentage gain of 1, 120%.ANALYSIS:
*1. Which date in the sample saw the largest overall trading volume? *
August 24, 2015 had the largest overall trading volume with a total of 4,607,945,196 shares sold that day. This is indicated by the largest peak in the line chart that visualizes the sum of the trading volume per day within the sample.2. On that date, which two stocks were traded most?
The two stocks that were traded the most on August 24, 2015 were Bank of America Corp (BAC) and Apple Inc (AAPL). These were found by finding the sum of the trading volume for each stock filtered down to August 24, 2015. The results were sorted in descending order and then filtered to the top 2 stocks.3. On which day of the week does volume tend to be highest? Lowest?
Fridays had the largest trading volume while Mondays had the lowest. In fact, it looks like the average per day is in the reverse order of the work week. This may be due to the excitement for the weekend to start and the Monday lows could be due to people feeling down after returning to work after a weekend or receiving bad news on a weekend. A bar chart showing the average trading volume grouped by each weekday helped solve this question.4. On which date did Amazon (AMZN) see the most volatility?
Amazon (AMZN) saw the most volatility on June 9, 2017 with a volatility of 85.99. Volatility is measured by the difference in the high and low price for the day. To chart this data, I created a calculated field to subtract the lowest price of the day from the highest and then charted that result on a line chart.5. If you could go back in time and invest in one stock from 1/2/2014 – 12/29/2017, which would you choose? What % gain would you realize?
If I could go back in time, I would have invested in Nvidia (NVDA). The reason I chose this stock was because it had the highest percentage gain of them all. If I purchased a share of stock on January 2, 2014 and sold it on December 29, 2017 I would have a percentage gain of 1,120%. The closing cost on January 2, 2014 was $15.86 and on December 29, 2017 it was $193.50.
Tableau | Electronic Store Sales

THE DATA:
This data is for an electronics store. The dataset contained a file for January Sales, February Sales and Customer information. The data was first brought into Excel to be cleaned, uploaded into Tableau and analyzed to answer the following questions.QUESTIONS:
1. How many orders were created in February?
2. Which day sold the most products?
3. What is the total revenue for all sales from Boston?
4. Which state had the most orders? Highest revenue?
5. What was the most popular product? Least Popular?
6. Which product made the most revenue? Least Revenue?INSIGHTS:
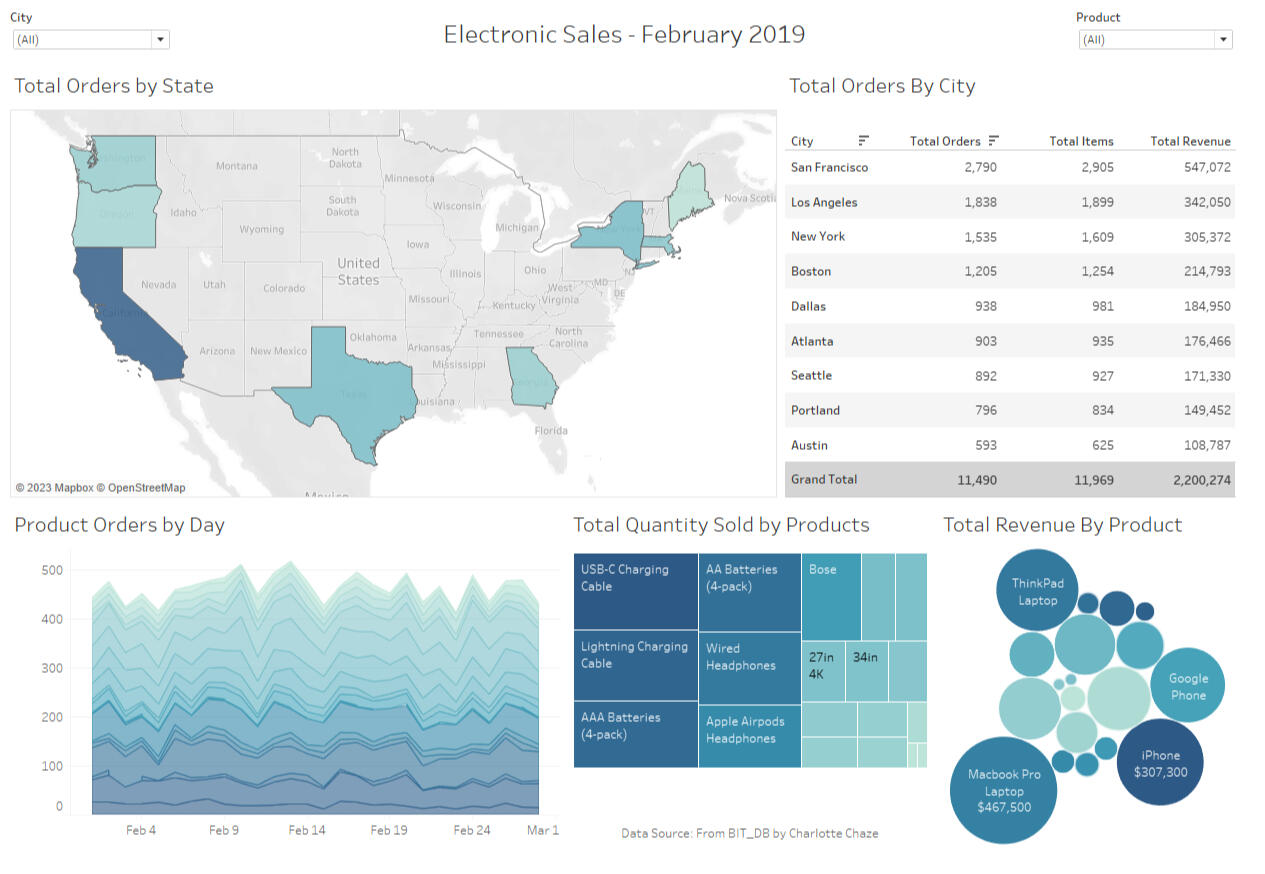
1. There were a total of 11,490 unique orders in February 2019.
2. February 13th sold the highest number of products.
3. Boston had a total Revenue of $214,793.
4. California had the most orders with a total of 4,628 orders. They also had the highest revenue with a total of $889,122.
5. The most popular product was the USB-C Charging Cable with a total of 1,513 units sold. The least popular product was the LG dryer with 38 units sold.
6. The Macbook Pro Laptop had the highest revenue with a total of $467,500. The product with the lowest revenue was the AAA Batteries (4-Pack) with a total revenue of $5,893.ANALYSIS:1. How many orders were created in February?
There were a total of 11,490 unique orders in February 2019. This was found by doing a distinct count of the order numbers. Since a new row is created in the system for each product that is ordered in an order, it is important to count the distinct order numbers to not duplicate the count. This would have been a difference of 479 more orders and would not have been an accurate representation.2. Which day sold the most products?
February 13th sold the highest number of products. This is found by looking for the tallest peak in the Product Orders by Day chart.3. What is the total revenue for all sales from Boston?
Boston had a total Revenue of $214,793. Boston appears to be in the top half of the performing cities for the company, but produces less than half the revenue of the top producing city of San Francisco.4. Which state had the most orders? Highest revenue?
California had the most orders with a total of 4,628 orders. They also had the highest revenue with a total of $889,122. They had three times the number of orders and revenue compared to the next highest state which was New York.5. What was the most popular product? Least Popular?
The most popular product was the USB-C Charging Cable with a total of 1,513 units sold. The least popular product was the LG Dryer with 38 units sold. Being that the USB-C Charging Cable is a lower price point item it makes sense that there are alot of sales for this product. The LG Dryer on the other hand is costly and dryers are a product that are not replaced often.6. Which product made the most revenue? Least Revenue?
The Macbook Pro Laptop had the highest revenue with a total of $467,500 even though it is in the lower 3rd of the items when it comes to quantity sold. The product with the lowest revenue was the AAA Batteries (4-Pack) with a total revenue of $5,893 even though it is in the top 3 items sold.RECOMMENDATIONS:
My recommendations moving forward would be to focus on the electronics related to phones and computers as those seem to do best in terms of revenue. Although the Macbook Pro did not sell a lot of units, it was the highest revenue item for the store. I would recommend some focus around the Macbook Pro to increase sales and therefore the revenue.
Excel | #66DaysOfData
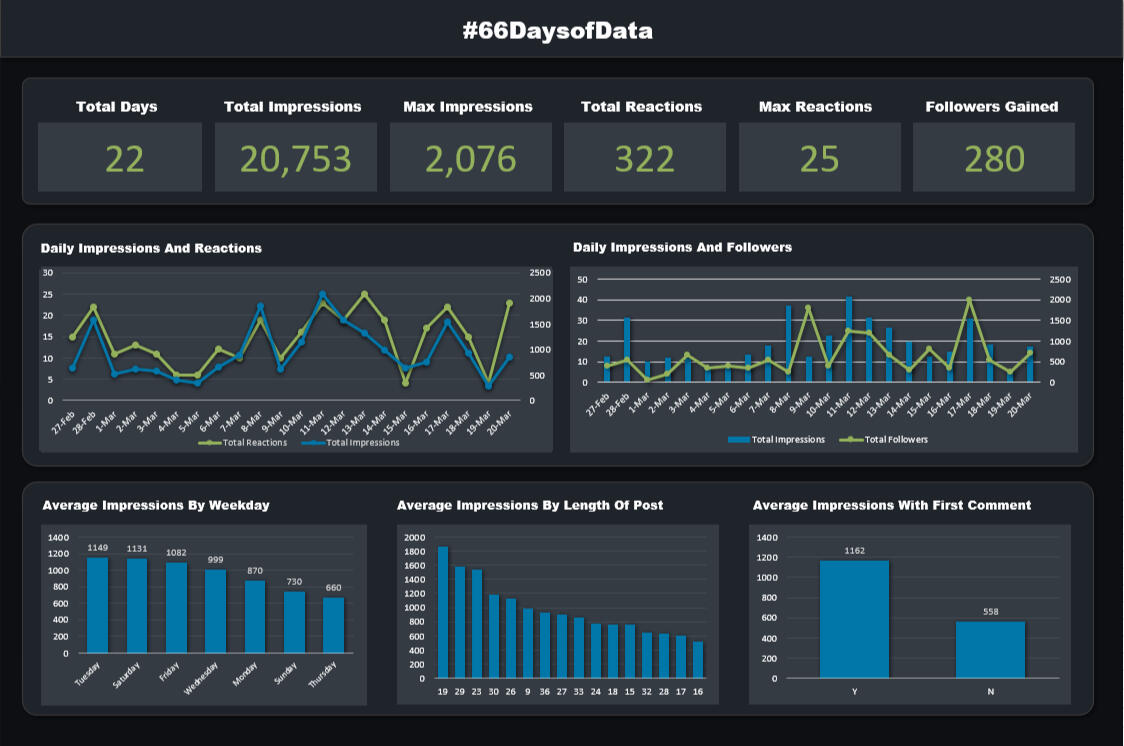
First iteration of the dashboard.
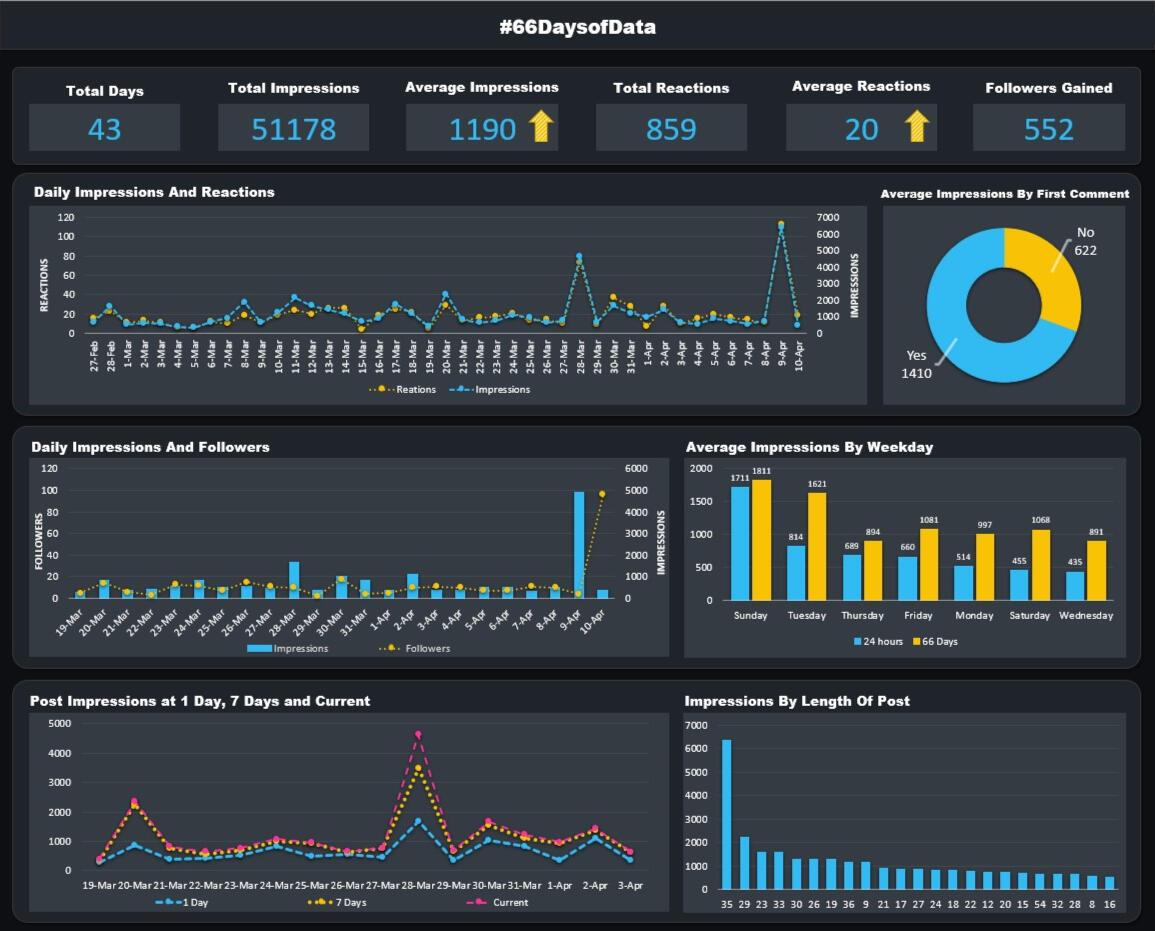
Second iteration of the dashboard.
THE DATA:
I took on the #66DaysOfData challenge by sharing my data analytics learning journey on LinkedIn. After a few days of posting, I decided to start tracking some of the data in Excel. I started with just the Date, Time, Topic, Reactions, Comments, and Impressions. Over time, I decided I wanted to track more items ended up tracking these metrics after 24 hours of posting, after 7 days, and the current numbers at the time of creating this dashboard.To complete this dashboard, I collected the data is from my own LinkedIn and created a table in Excel. Then I created various Pivot Tables to compare different metrics. I utilized those Pivot Tables to create charts. Lastly, I created a dashboard that included the tables.After looking at the data I came up with the following questions.
QUESTIONS:
1. Does the number of reactions influence the number of impressions?
2. Does the number of Impressions lead to an increase in followers?
3. What day of the week gets the most impressions?
4. Does the length of the post affect the number of impressions?
5. Does leaving the first comment on your own post increase the number of impressions?
6. Do posts get the most impressions within the first 24 hours?INSIGHTS:
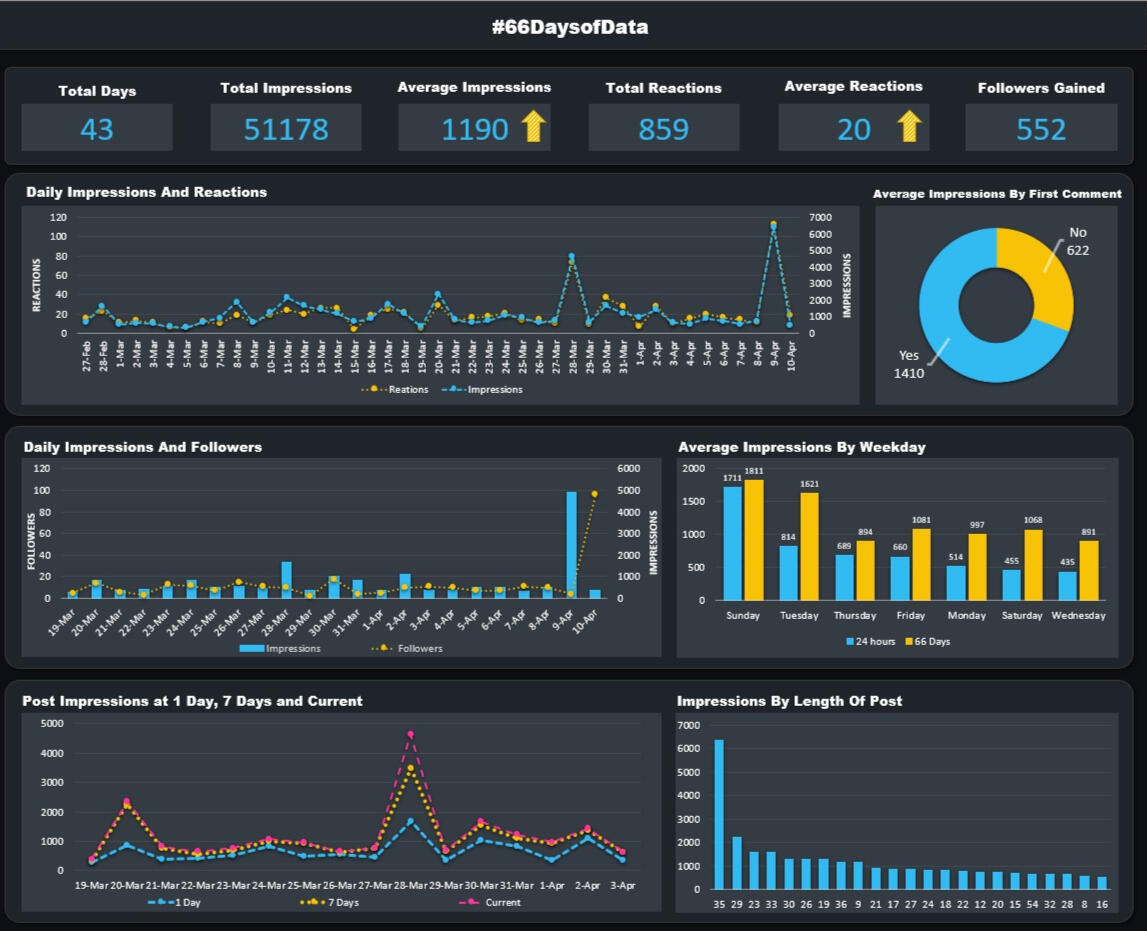
1. There seems to be a correlation between reactions and impressions.
2. Overall, there seems to be a correlation between impressions and followers per day.
3. Sundays and Tuesdays get the most impressions where Saturdays and Wednesdays get the lowest impressions at the 24 hour mark. Posts on Wednesdays and Thursdays performed the worst when it came down to overall impressions.
4. There is no correlation between the length of the post and the number of impressions.
5. On average, there are double the impressions on posts where the first comment is left.
6. Most posts received moderately low impressions within the first 24 hours and maxed out within a week.ANALYSIS:1. Does the number of reactions influence the number of impressions?
Overall, there is a correlation between the number of impressions and the number of reactions. This makes sense since the post is refreshed into someone feed when one of our mutual connections reacts to the post which in turn, bring about more impressions.2. Does the number of Impressions lead to an increase in followers?
The number of Followers seemed to follow the rise and fall of the Total Impressions. If a post got a lot of impressions, I got more followers that day, or the day immediately after. As the number of impressions fell, so too did the number of new followers which suggests a correlation. These results make sense along with the results from the first question. The more people that react to your posts, the more people see your post, and the higher the chance will be that it is someone outside of your network and they may want to follow you.3. What day of the week gets the most impressions?
I have always heard that Tuesdays - Thursdays where the best days to post on LinkedIn. For this data I used a column chart with the average impressions for each weekday and sorted them in descending order. This showed me that the impressions after 24 hours were highest on Sundays and Tuesdays. The two lowest days of the week for me were Saturdays and ultimately Wednesdays. These results surprised me as I thought Sundays and Wednesdays would be reversed.At the time the second iteration was created, the average impressions for all posts were highest's for posts made on Sundays and on Tuesdays. They were lowest on Thursdays and Wednesdays.4. Does the length of the post affect the number of impressions?
Looking at the data, it appears that the length of the post does not have an effect on the impressions. on the first iteration, the posts that had 19 lines of text got the most impressions while the posts with 16 lines got the least. In the second iteration, the post with 35 lines of text had the most impressions while the post with 16 lines had the least. Between these two categories are post lengths of both greater and lesser values.5. Does leaving the first comment on your own post increase the number of impressions?
It appears that the posts in which I left the first comment had, on average, more impressions than those without. Looking at the overall data set, I did not start leaving a comment first until the 7th post or so. Therefore, the lower average of the “no” column may be due to the fact that it was early in the challenge with less followers. However, the average seems to be over double the impressions.*6. Do posts get the most impressions within the first 24 hours?
After 24 hours of making a post, the impressions were relatively low. When measured again at the 7 day mark, all posts had an increase. Some slight while others significantly more. 7 days seemed to be the peak for the vast majority of the posts as many did not grow past this point.__RECOMMENDATIONS: __
If a business is looking to improve their engagement on LinkedIn, it may be good to evaluate trends in their current posts and lean on their results. If my results were from a business, I would make the following recommendations:- Utilize Sundays and Tuesdays for post that the company wants to get the most impressions on. Saturdays and Wednesdays should have post that may be less important.
-The length of the post does not matter too much as long as the content is interesting and can bring in the audiences attention.
-If possible, start the conversation with the first comment on the post.
-Consistency is key. Try to post daily if possible.
Excel | New Project
THE DATA:QUESTIONS:INSIGHTS:ANALYSIS:1.
SQL | Media Store Analysis
THE DATA:
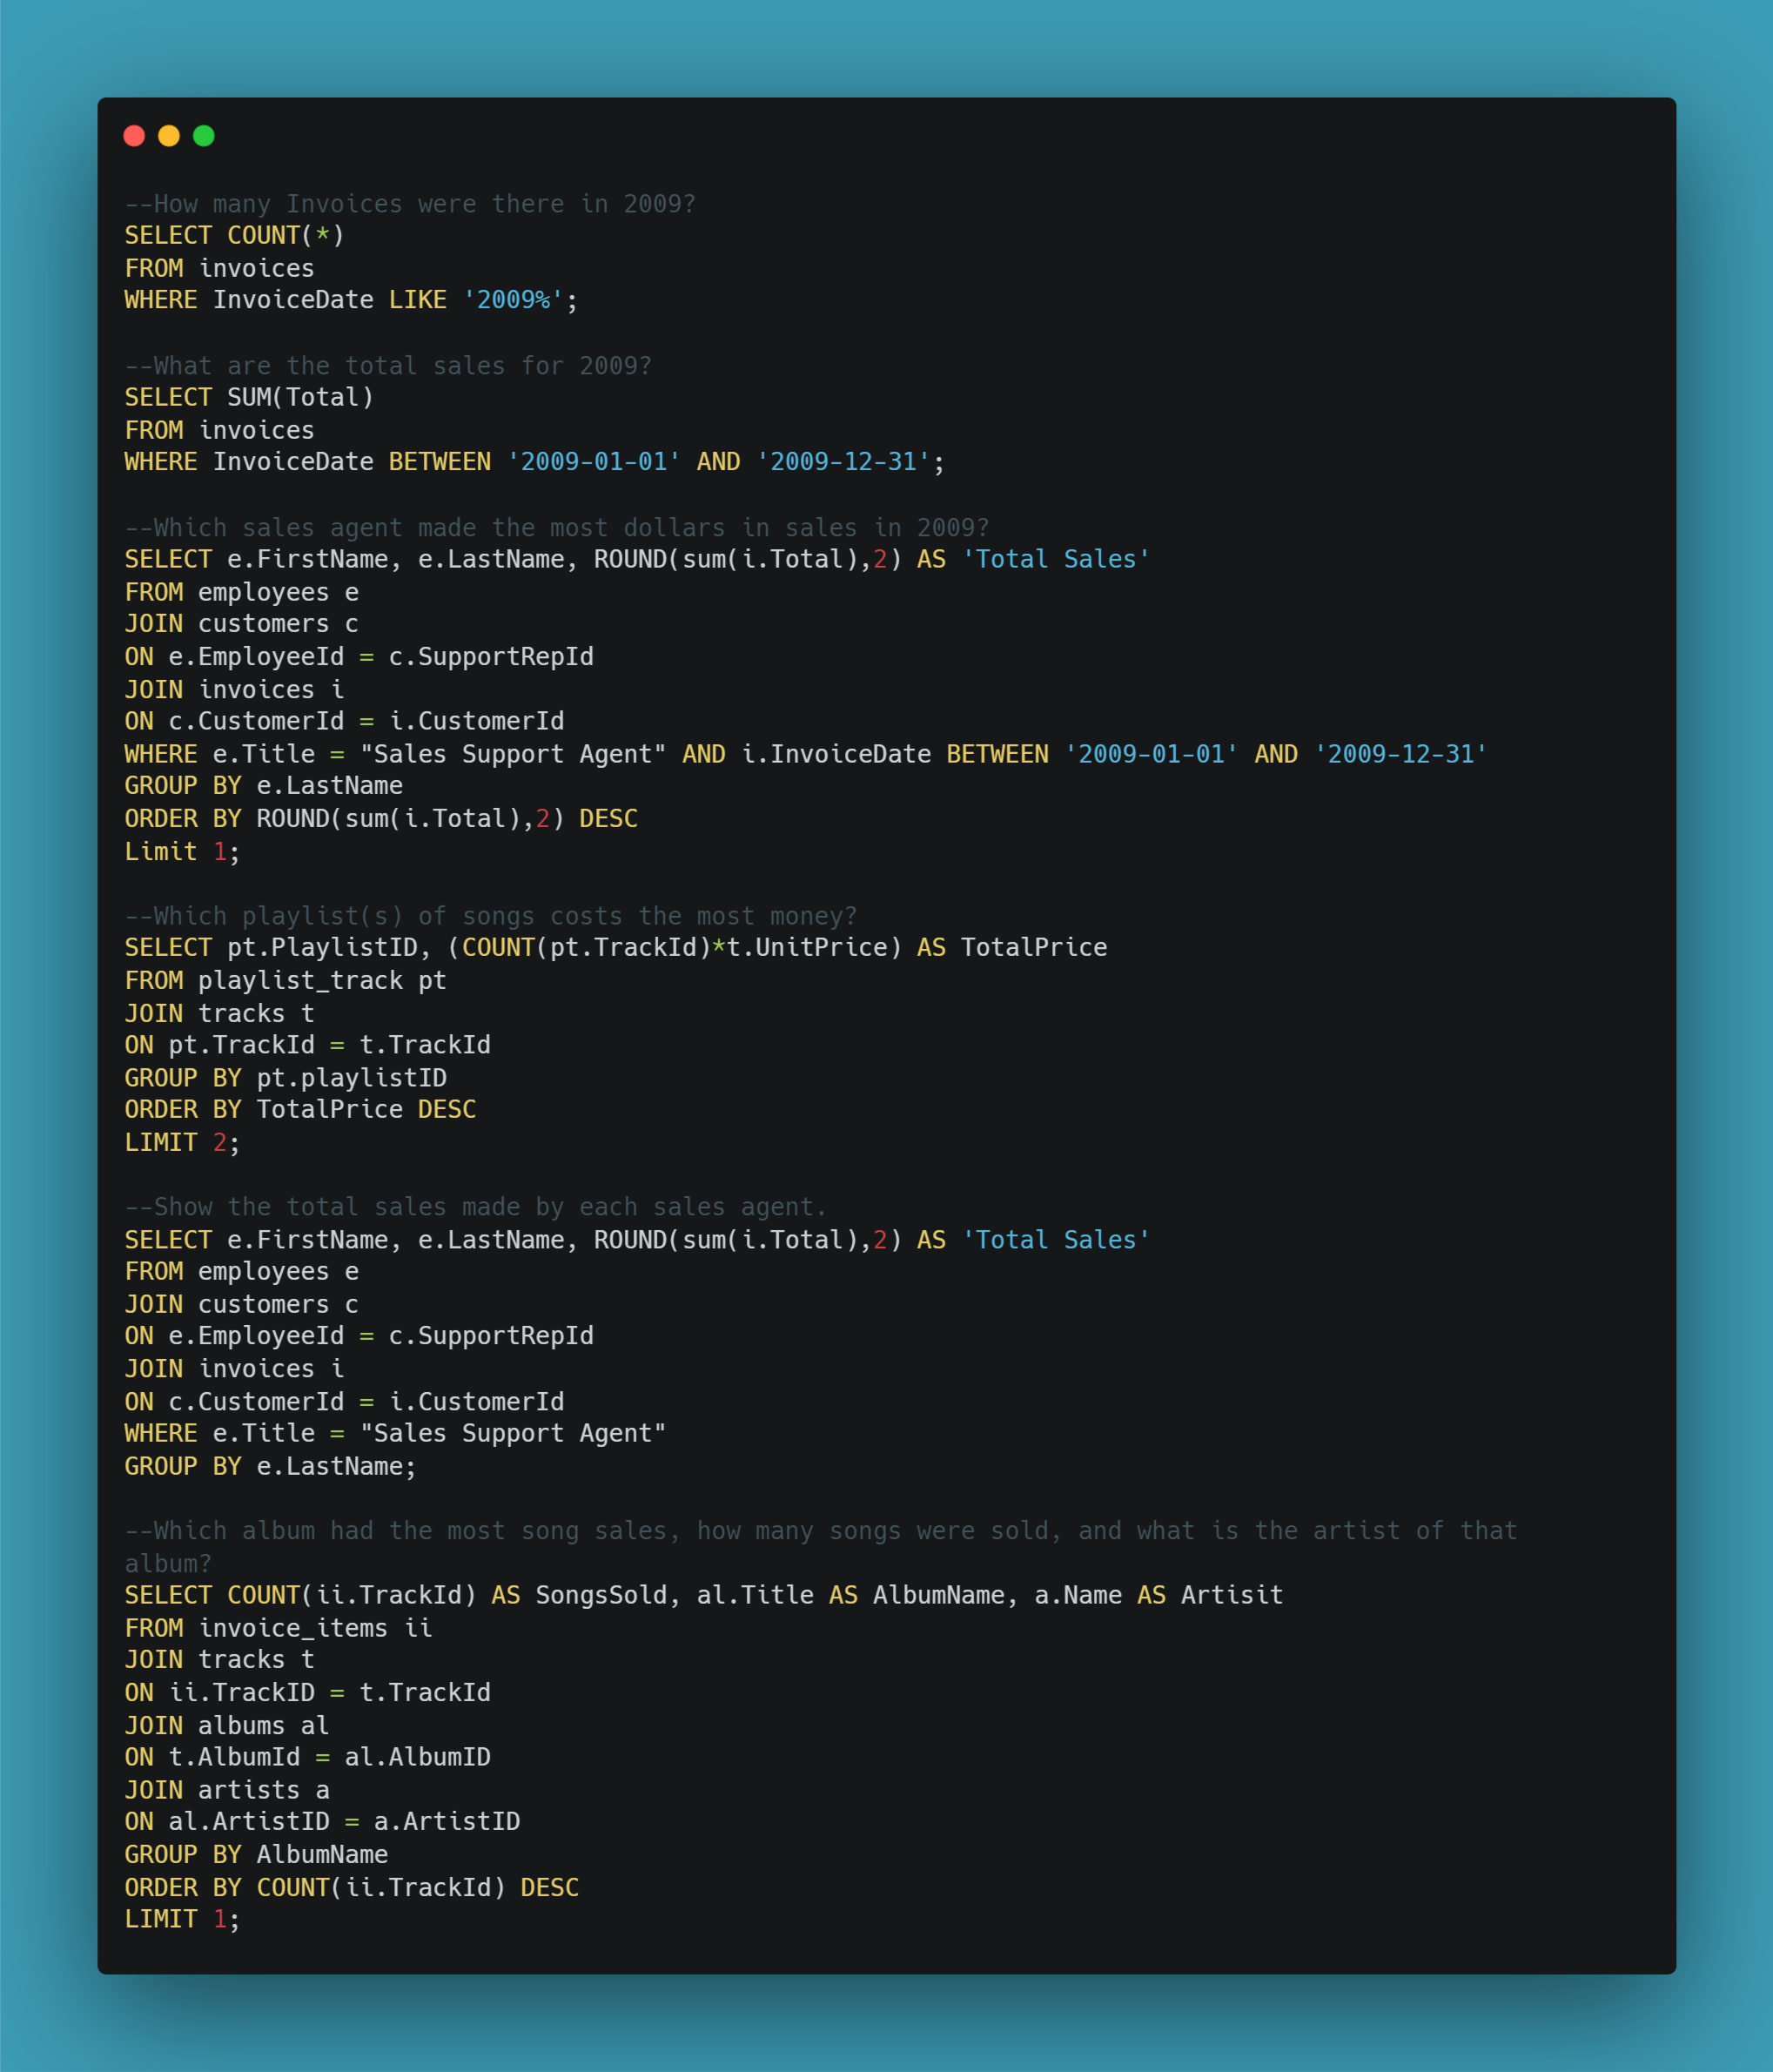
The dataset was a database file (.db) that was opened in SQLite to run queries. I was then given a list of questions about the Chinook Media Store to answer with SQL. Click on the button below to see all queries for these questions.QUESTIONS:
1. Show Customers (their full names, customer ID, and country) who are not in the US.
2. Show only the Customers from Brazil.
3. Find the Invoices of customers who are from Brazil. The resulting table should show the customer's full name, Invoice ID, Date of the invoice, and billing country.
4. Show the Employees who are Sales Agents.
5. Find a unique/distinct list of billing countries from the Invoice table.
6. Provide a query that shows the invoices associated with each sales agent. The resulting table should include the Sales Agent's full name.
7. Show the Invoice Total, Customer name, Country, and Sales Agent name for all invoices and customers.
8. How many Invoices were there in 2009?
9. What are the total sales for 2009?
10. Write a query that includes the purchased track name with each invoice line ID.
11. Write a query that includes the purchased track name AND artist name with each invoice line ID.
12. Provide a query that shows all the Tracks, and include the Album name, Media type, and Genre.
13. Show the total sales made by each sales agent.
14. Which sales agent made the most dollars in sales in 2009?SKILLS USED:
The following skills were used to answer the questions above:
-COUNT
-Aggregate Functions
-ROUND
-Aliases
-JOINs
- LIKE %
-BETWEEN
-GROUP BY
-ORDER BY
-LIMIT
SQL | Business Questions

THE DATA:
All of the following are practice questions from various websites such as DataLemur (DL) and Leetcode (LC) that I answered on my own. They demonstrate a variety of complexity and functions that I wanted to highlight. Click on the button below to see all queries for these questions.QUESTIONS:
1. (DL) Who are the candidates who possess all of the required skills (proficient in Python, Tableau, and PostgreSQL) for the job? The output should be in ascending order.
2. (DL) What are the page IDs of all the Facebook pages that don't have any likes? The output should be in ascending order.
3. (DL) Which parts have begun the assembly process but are not yet finished?
4. (DL) How many users view the content on a laptop vs a mobile device?
5. (DL) List the top three cities that have the most completed trade orders in descending order.
6. (DL) Given a table of bank deposits and withdrawals, return the final balance for each account.
7. (DL) Obtain a histogram of tweets posted per user in 2022. Output the tweet count per user as the bucket, and then the number of Twitter users who fall into that bucket.
8. (DL) Write a query to get the average stars for each product every month. The output should include the month in numerical value, product id, and average star rating rounded to two decimal places. Sort the output based on month followed by the product id.
9. (DL) Which personal profiles have more followers then the company they work for?
10. (DL) Who are the top three customers that have spent at least $1000 total and how many products have the purchased?
11. (LC) Write an SQL query to find for each user, the join date and the number of orders they made as a buyer in 2019.
12. (LC) Write an SQL query to report the Capital gain/loss for each stock.
13. (DL) Write a query to obtain a breakdown of the time spent sending vs. opening snaps (as a percentage of total time spent on these activities) for each age group. Output the age bucket and percentage of sending and opening snaps. Round the percentage to 2 decimal places.
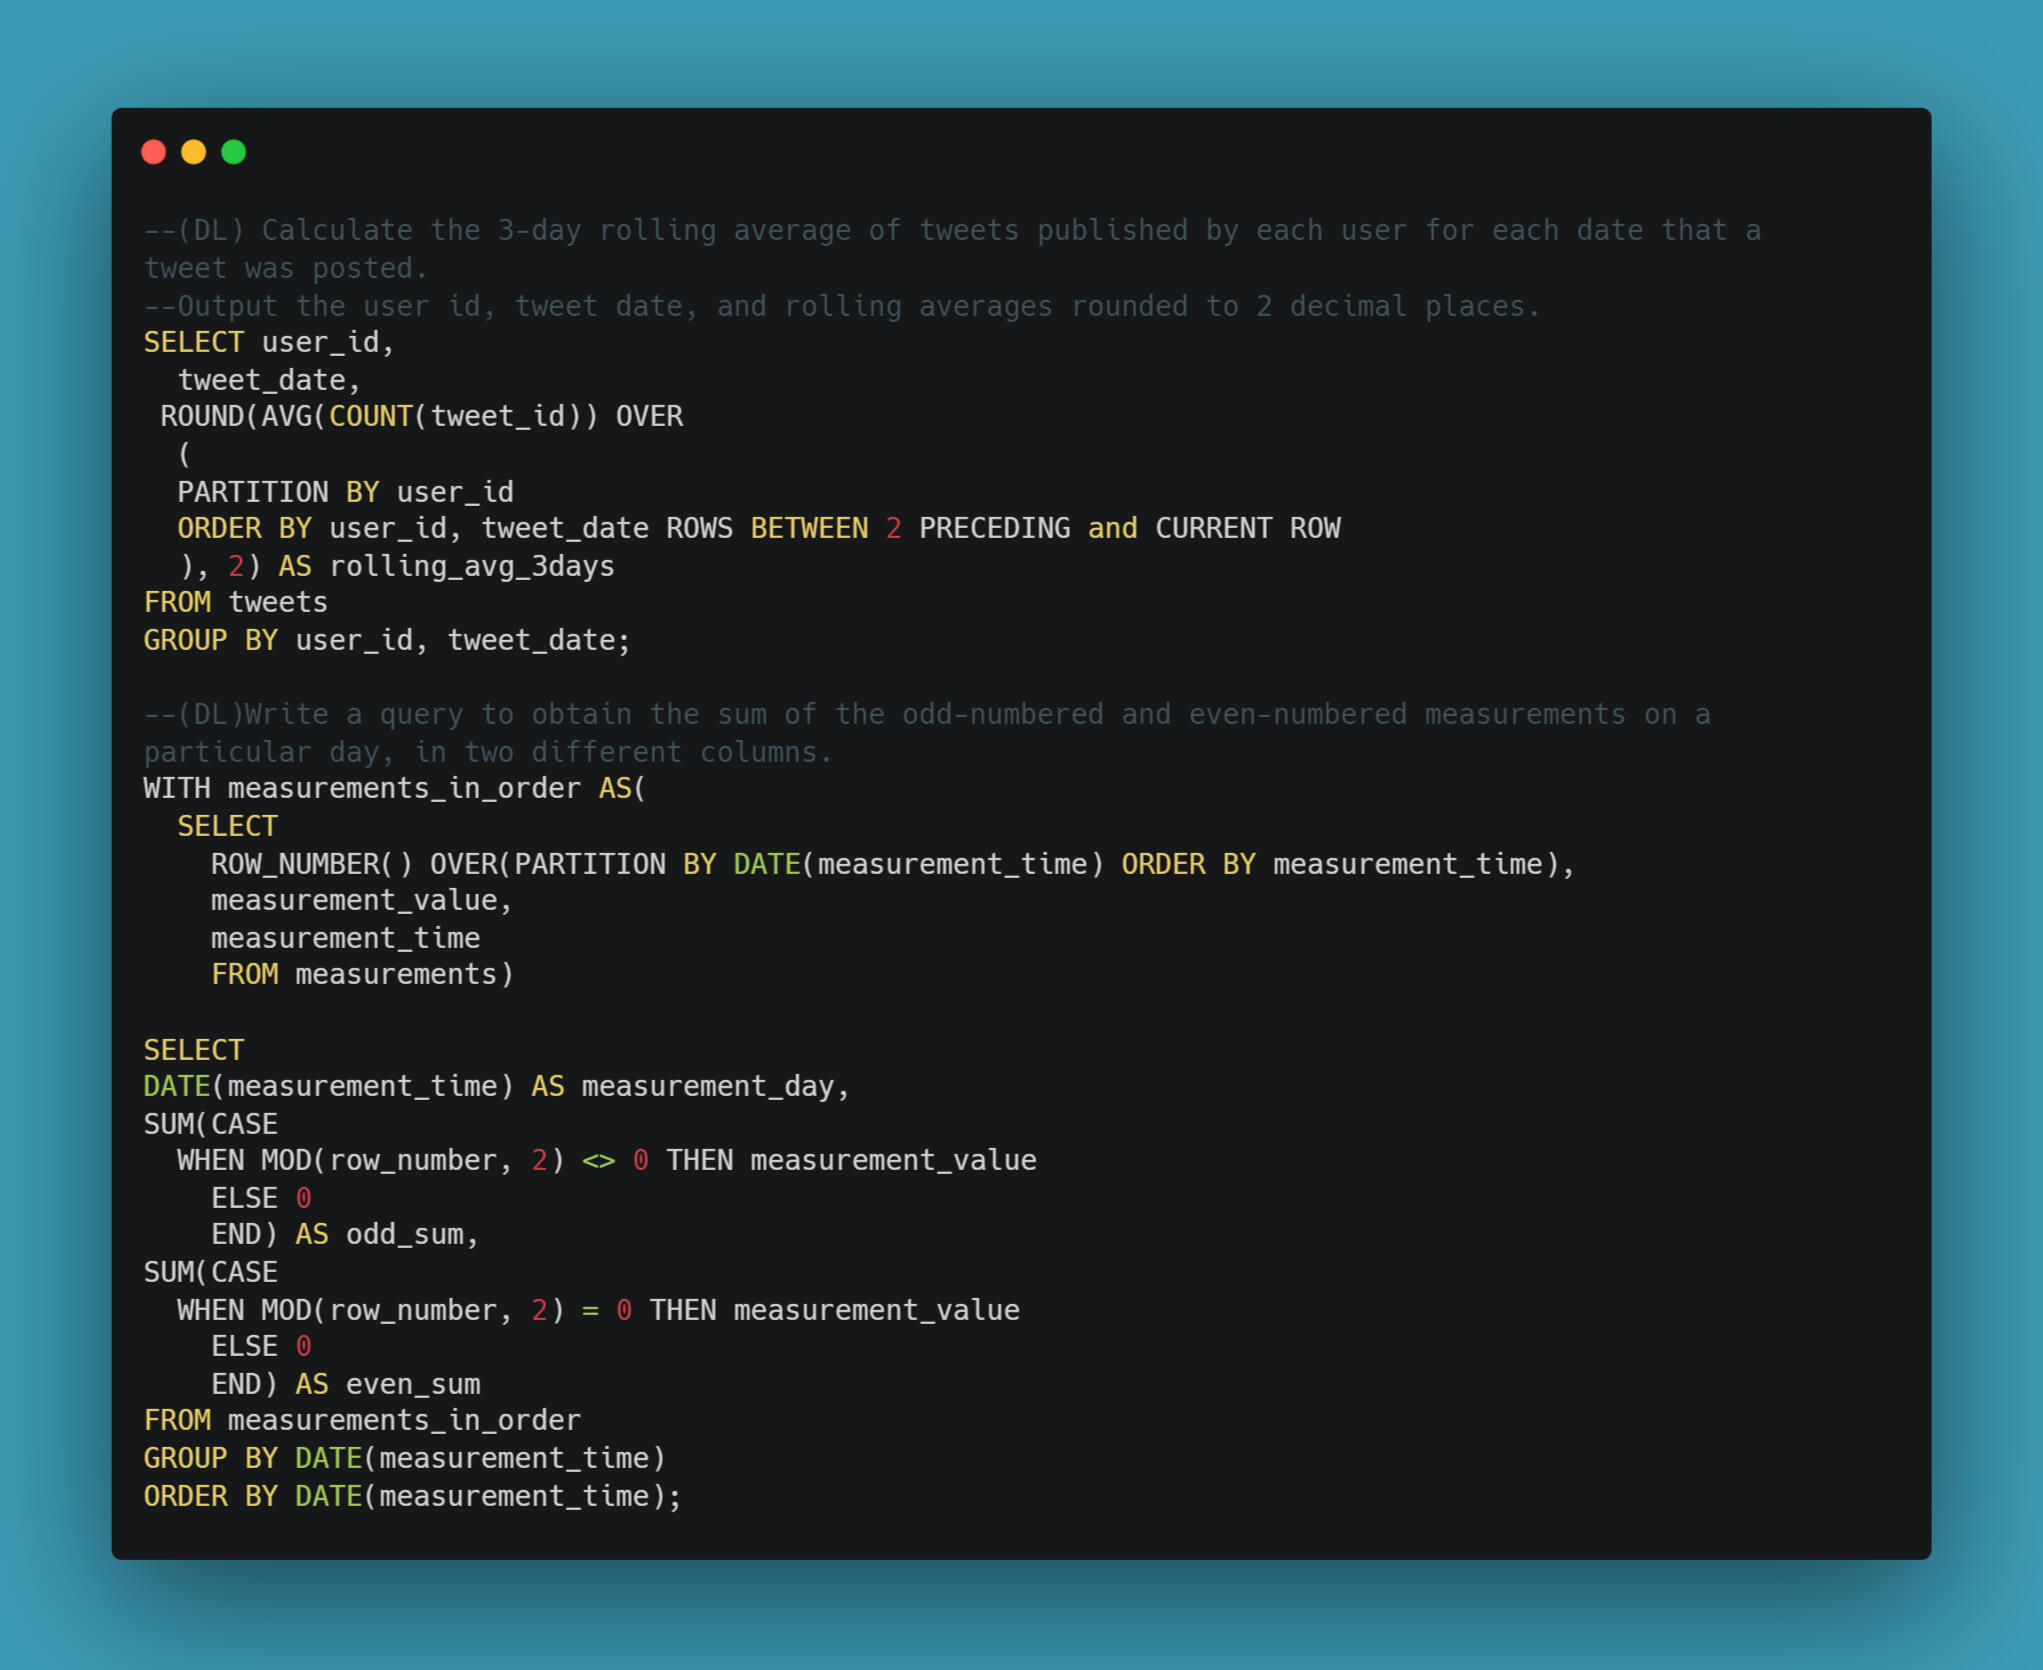
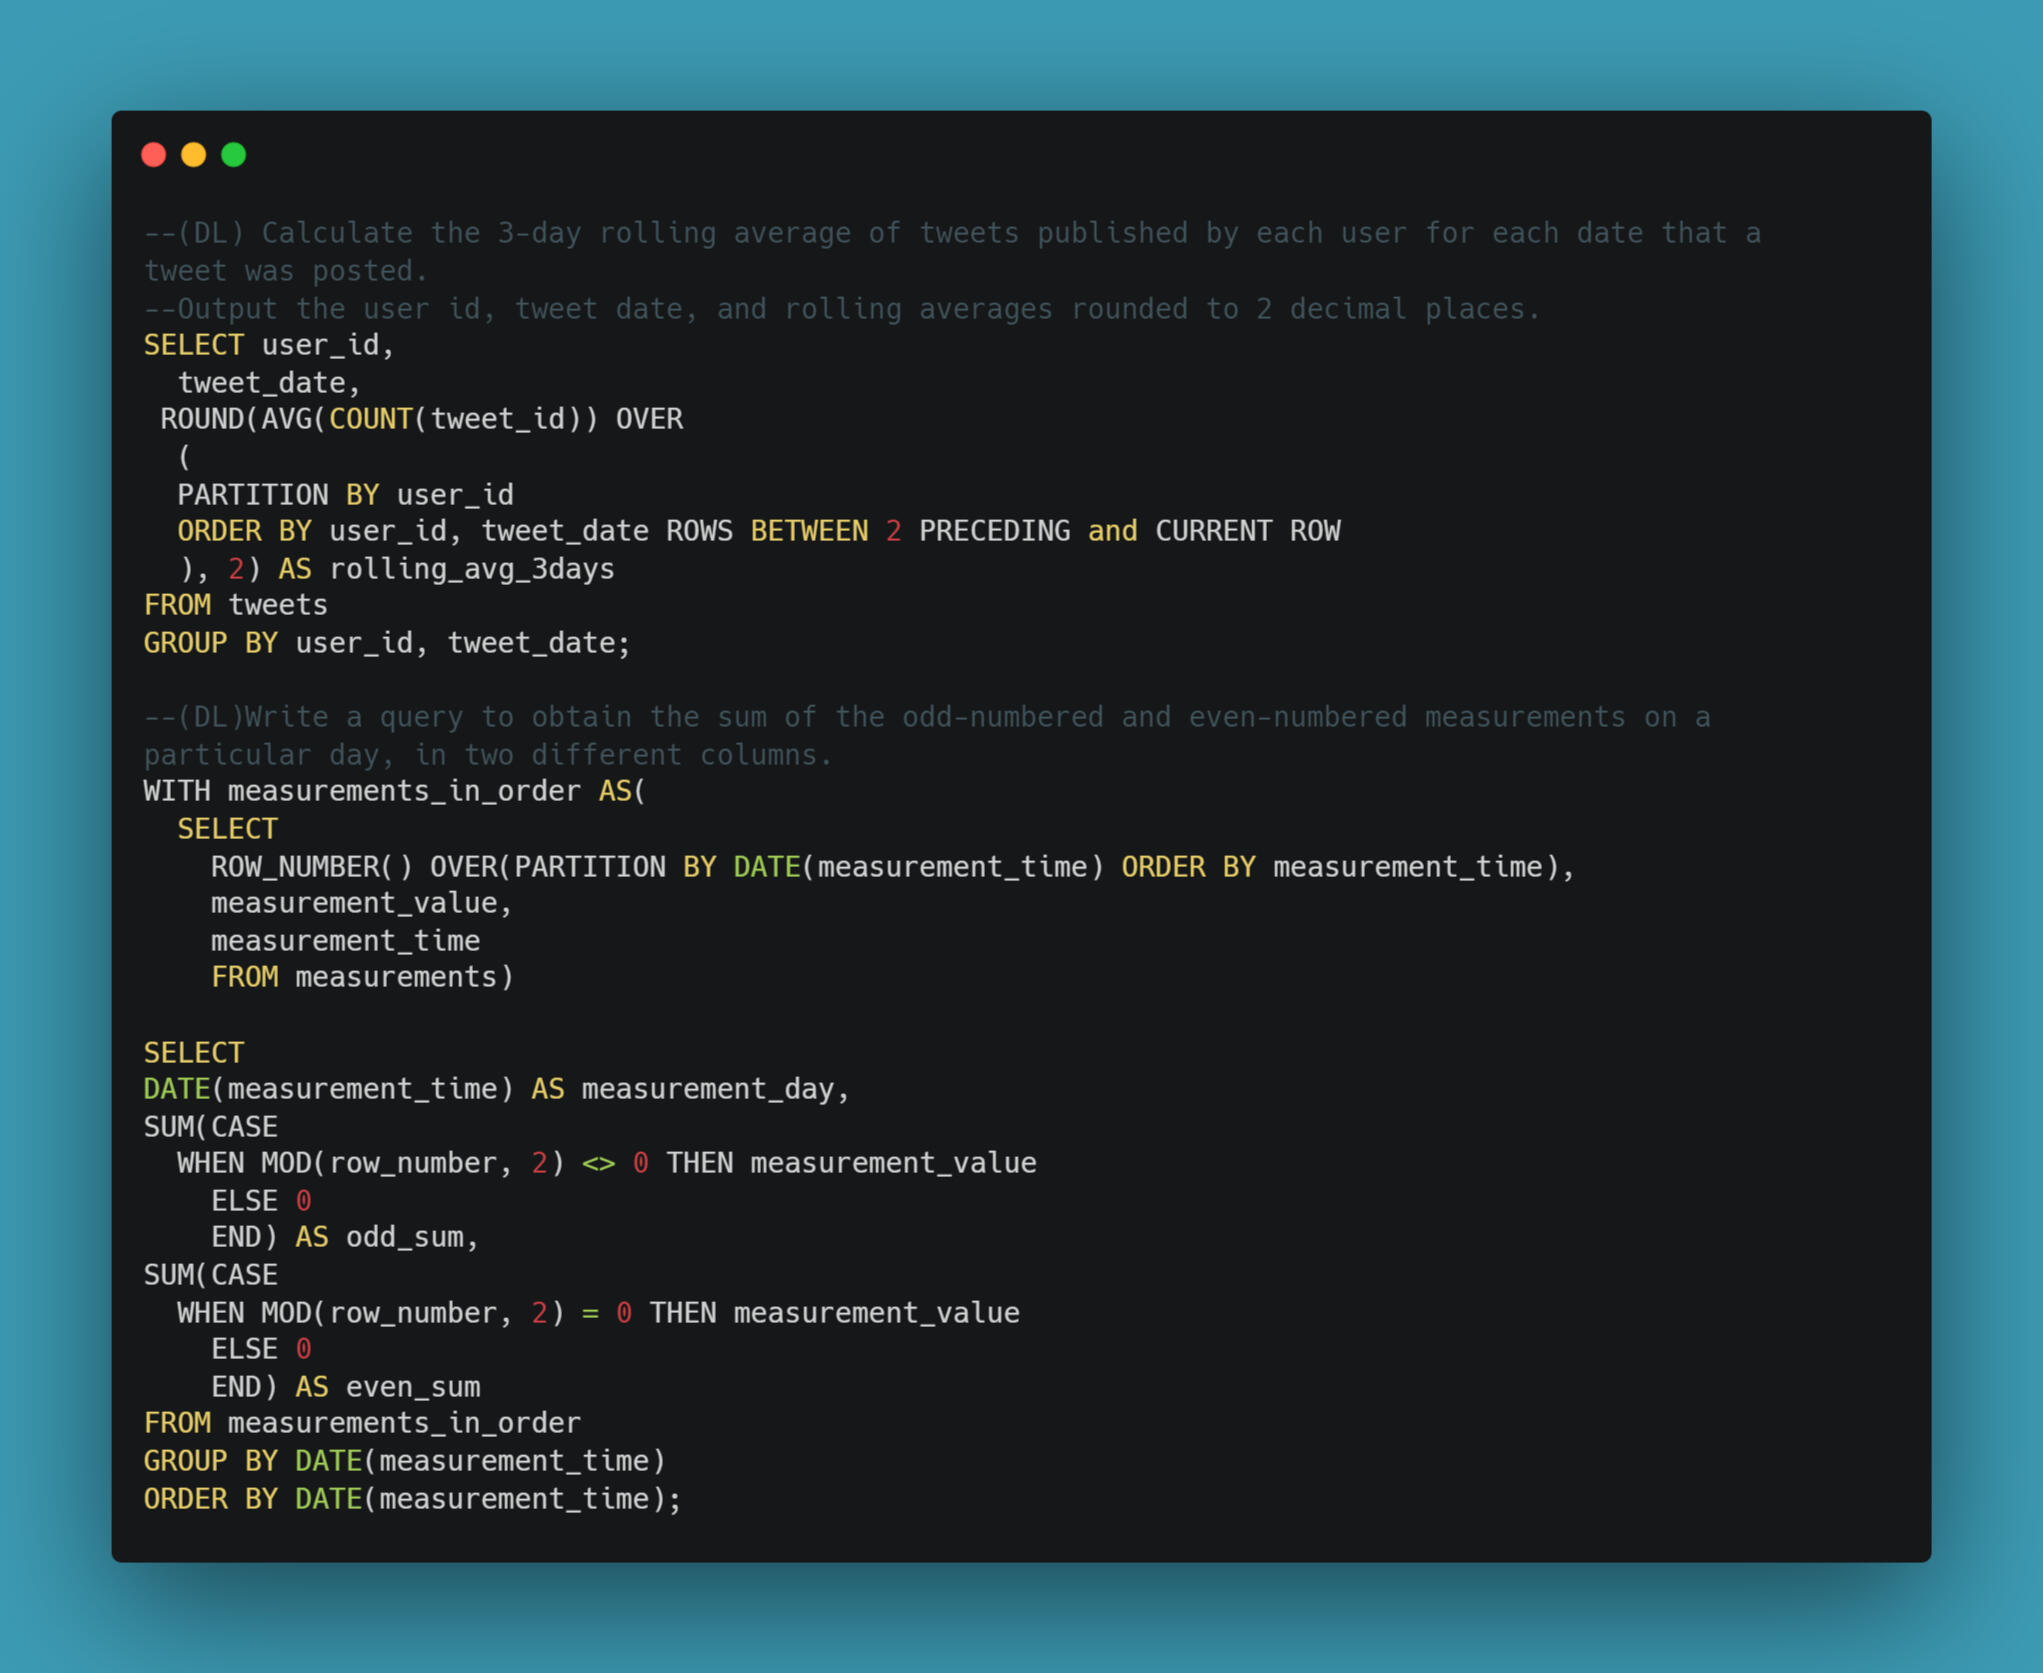
14. (DL) Calculate the 3-day rolling average of tweets published by each user for each date that a tweet was posted. Output the user id, tweet date, and rolling averages rounded to 2 decimal places.
15. (DL)Write a query to obtain the sum of the odd-numbered and even-numbered measurements on a particular day, in two different columns.SKILLS USED:
The following skills were used to answer the questions above:
-JOINs
-Aliases
-IN
-AND
-IS NULL
-CASE
-COUNT
-CTEs
-Subqueries
-BETWEEN
-EXTRACT
-ROUND
-Window Functions
-ROW_NUMBER
-MOD
Thanks!
Thank you for checking out my portfolio! I hope you liked my work.